Stock market cycles are long and ever changing. The relationship between the biggest and smallest stocks is a good example.
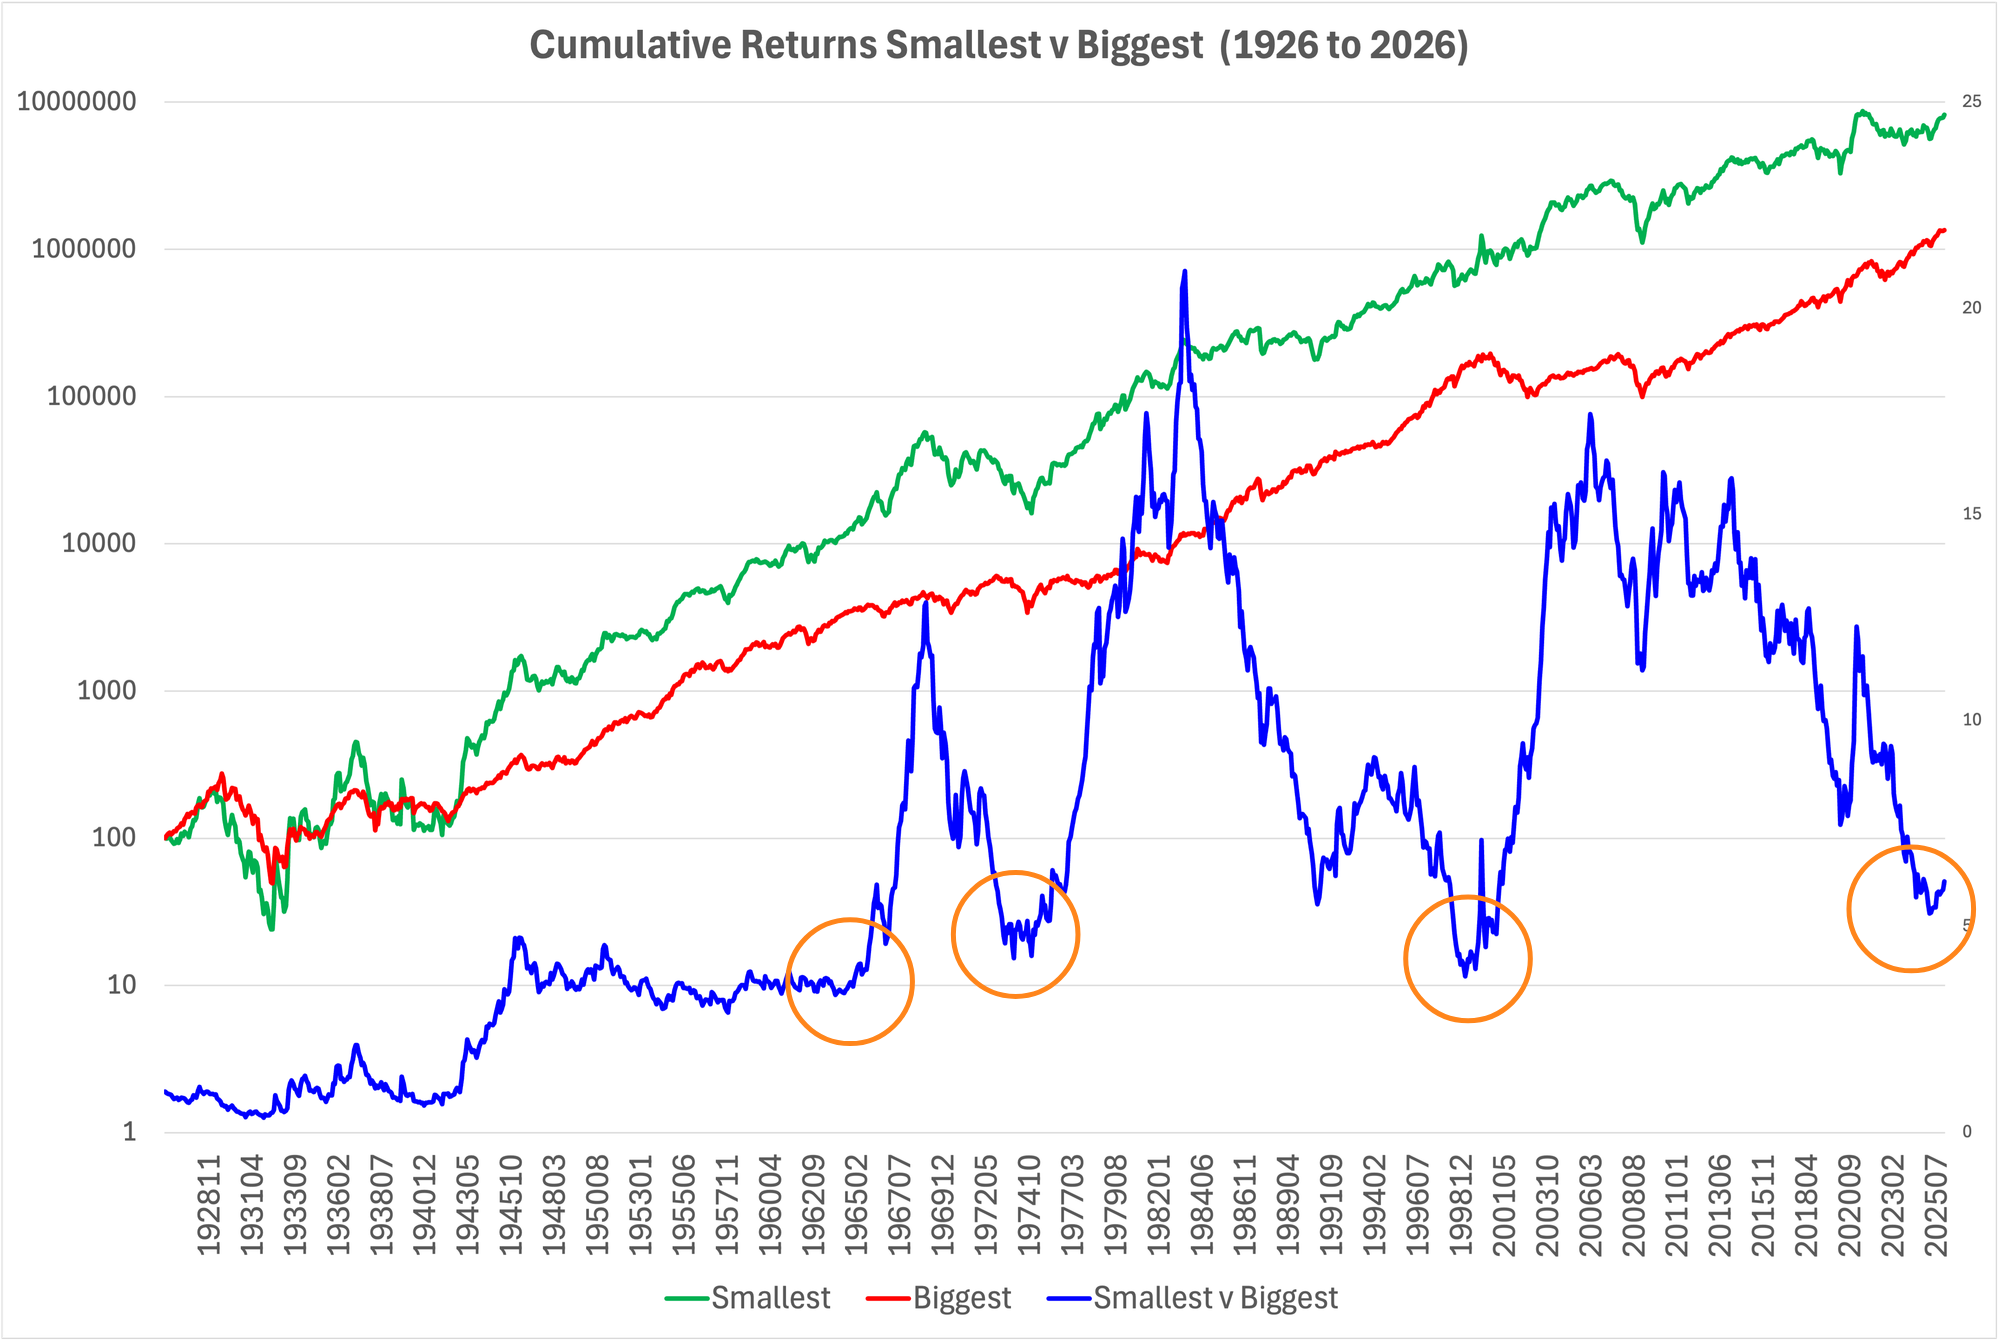
Over the last century the smallest stocks (green, LHS) have beaten the biggest stocks (red, LHS) by six times (blue, RHS). But not in a straight line. The market has cycled. And the cycles were long.
The blue line shows the small versus big market cycles. When the blue line rises, smalls win. When the blue line falls, the biggest win. There are several notable peaks and troughs (circled in orange) in the blue line:
- From 1964 to 1968 the smallest won.
- From 1969 to 1974 the biggest had their turn. This was the Nifty Fifty era.
- From 1975 to 1983 the smalls won again.
- From 1983 to 1999 the biggest too their turn. This ended with the first Dot Com boom.
- From 2000 to 2007 smalls won. This was the last golden age of value.
- Since 2007 the biggest have been dominant. This was the web 2.0 or social web boom and finally the A.I. boom.
- In 2026 we're at levels that have historically preceded small winning. The blue line turned up mid-2025, meaning smalls are already winning while the biggest have stalled.
We are at extreme historical levels
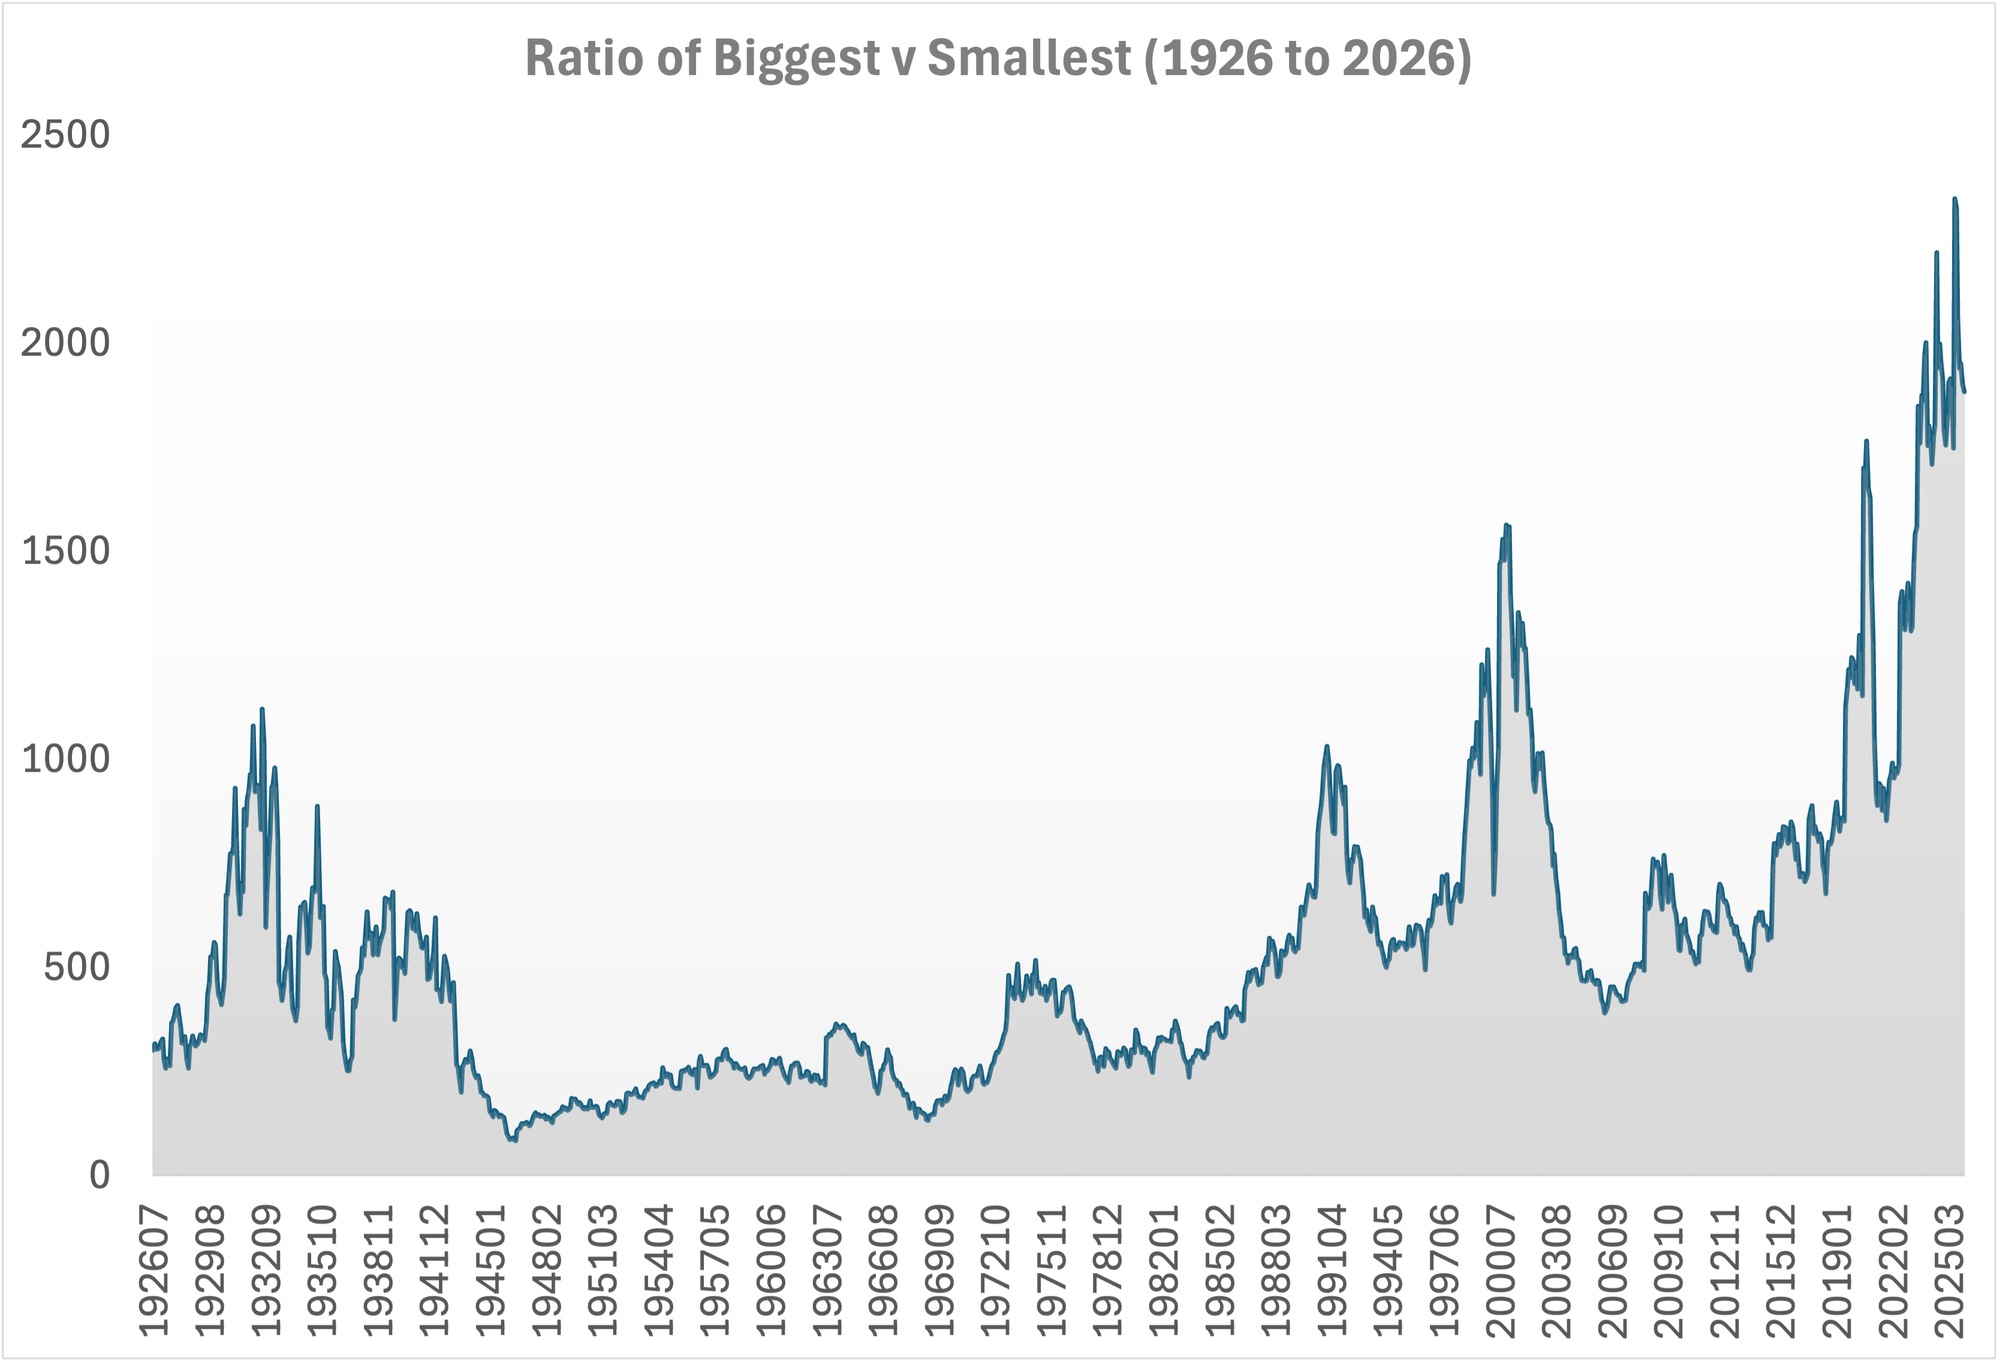
The second shows the relative sizes of the biggest and smallest stocks. We have just passed the most extreme levels in the last century. Today's ratio is still near all-time highs, exceeding the late 1990s Dot Com bubble and the early 2020s Meme Stock bubble.
Every prior extreme reversed. Each spike has lead to a collapse in the ratio. When this happens, the smallest win and the biggest stall. From 2000 to 2015, the biggest stocks went nowhere.
What drives these regime shifts
Smalls tend to win when:
- the economy accelerates (early in the business cycle)
- the crowded trades see multiple contraction
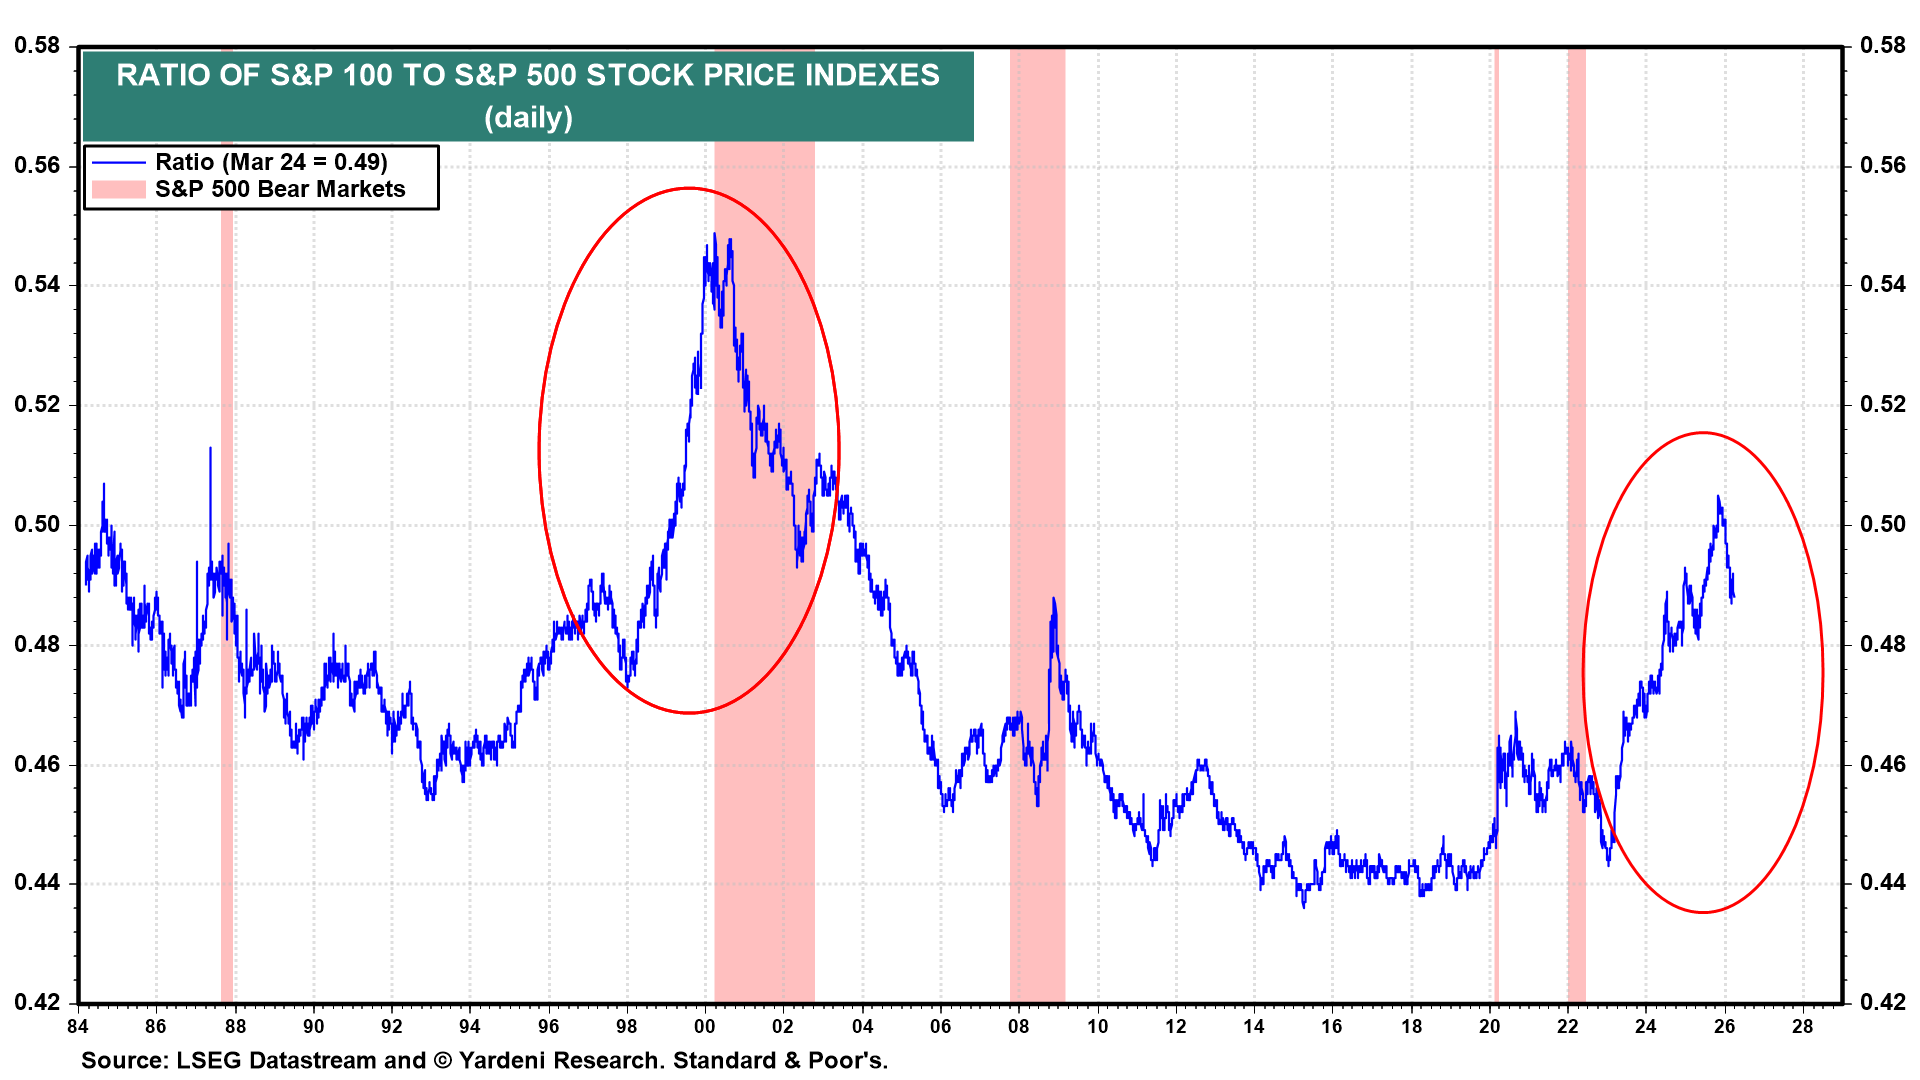
The market is extremely concentrated, dominated by the biggest of the big, the mega cap stocks, the Magnificent 7. History says this does not persist.
What breaks this thesis
The thesis fails if:
- Mega caps continue compounding without valuation compression
- Economic growth stays narrow (no breadth expansion)
- Rates/liquidity regime suppresses smaller companies
- Passive flows continue reinforcing concentration
The base case vs bull case
Base case (most likely):
- Gradual rotation
- Small outperforms over 3–5 years
- Not explosive, but steady
Bull case (what history suggests at extremes):
- Violent catch-up
- 2–3 years of:
- Smalls massively outperforming
- Big flat/down
This is what happened:
- 1975–83
- 2000–2007
We are at the most extreme large-cap dominance regime in a century. Those regimes have always reversed. When they do, small caps, value and cyclicals win.